
The Challenge: When Your Velocity Estimate Fails Right When You Need It Most
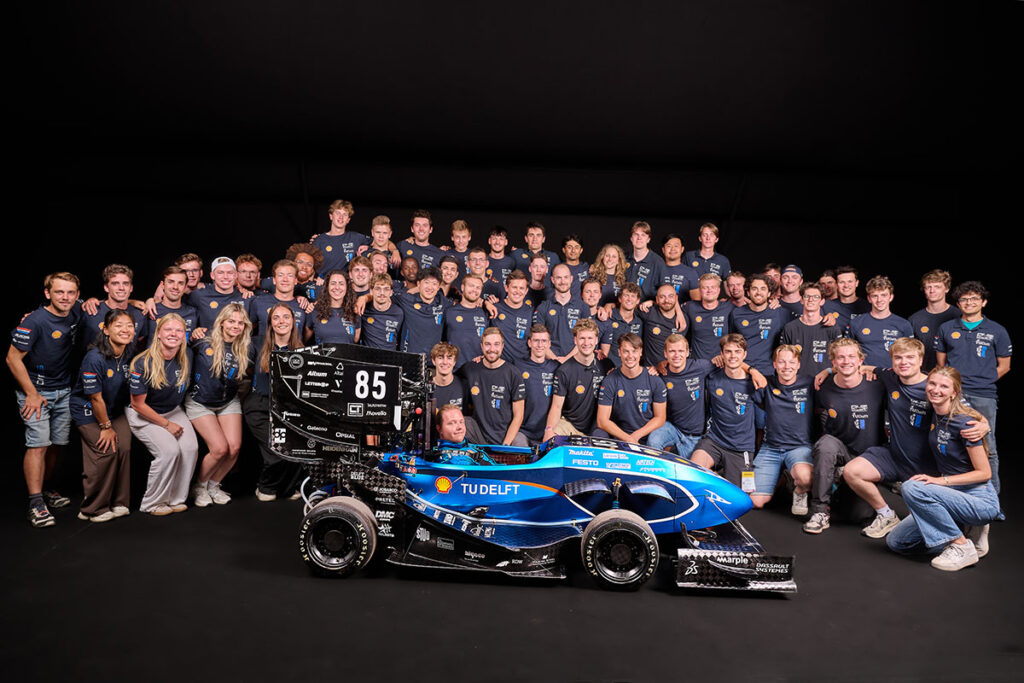
Formula Student is one of the most demanding engineering competitions in the world. Every year, university teams design, build, and race a single-seater from scratch – then compete head-to-head in both static design evaluations and on-track dynamic events. The Formula Student Team Delft, based at Delft University of Technology in the Netherlands, brings together students from 22 countries and has been competing internationally since 1999.
What makes these cars fast isn’t just raw power – it’s precision. Four independent electric motors enable individual wheel torque control, managed by advanced algorithms that continuously compute the optimal torque distribution. The Controls department runs the show here: traction control manages wheel slip during acceleration, while Torque Vectoring optimizes cornering by tracking a target yaw rate based on real-time velocity and steering input. All of these systems depend on accurate state estimation – velocity, acceleration, yaw, pitch, and roll, updated in real time.
That’s where the team ran into trouble. Their existing velocity estimator fused wheel speed and accelerometer data through a Kalman filter. Under normal conditions, it worked fine. But during hard launches, heavy braking, or any situation with significant wheel slip, the estimate would deviate by as much as 4 m/s from the actual vehicle speed. The irony? Those are exactly the moments when traction control needs the most accurate data to do its job.
The Solution: Ground Truth That Doesn’t Care About Wheel Slip
The team turned to the OMS Race optical velocity sensor from Sensoric Solutions. Unlike wheel-speed-based approaches, the OMS Race measures vehicle velocity by optically tracking the road surface – completely independent of tire slip. For the first time, the team had a reliable ground truth reference to validate and improve their estimation algorithms against.
Integrating the sensor into the DUT 25 car was straightforward. The team mounted it between the rear suspension linkages on the right side of the vehicle – a location chosen because existing electrical components and suspension links already occupied the area (minimizing aero impact), it was easily accessible for maintenance, and a nearby wiring passthrough made CAN bus integration simple. A custom-designed bracket, bonded with 3M EC-9323 structural adhesive, provided a rigid, rules-compliant mount without drilling into the load-bearing chassis.
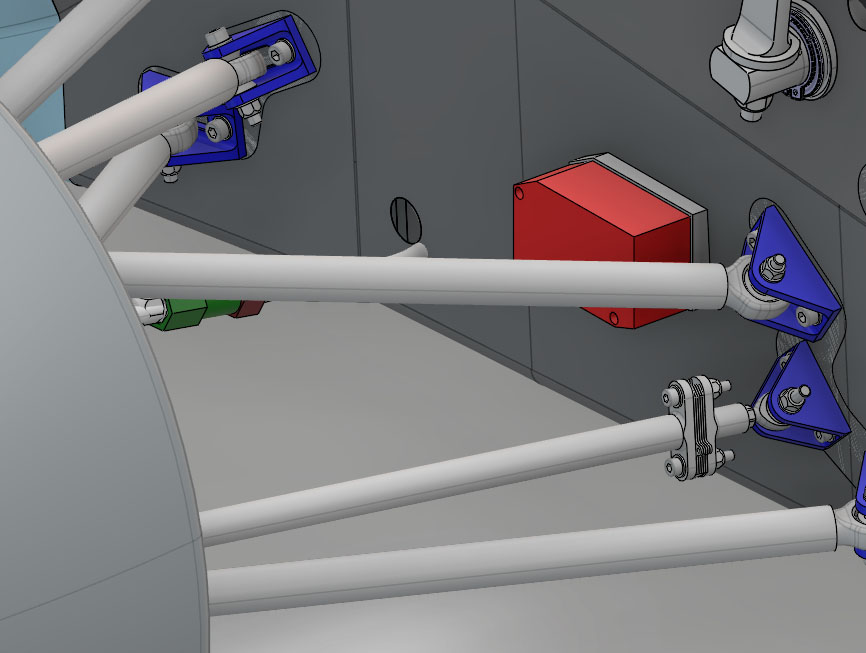
Location of the OMS Race on the DUT 25
The Results: Better Data, Faster Car
Velocity Estimation: Seeing Through the Slip
The difference was immediately obvious in the data. During acceleration runs recorded at a track in Strijen (August 2025), the wheel-speed-based estimator produced oscillating velocity traces – implying the car was alternately accelerating and decelerating. An independent IMU clearly showed sustained positive longitudinal acceleration throughout the same period. The old estimator’s oscillations were artifacts of wheel slip, not real vehicle behavior.
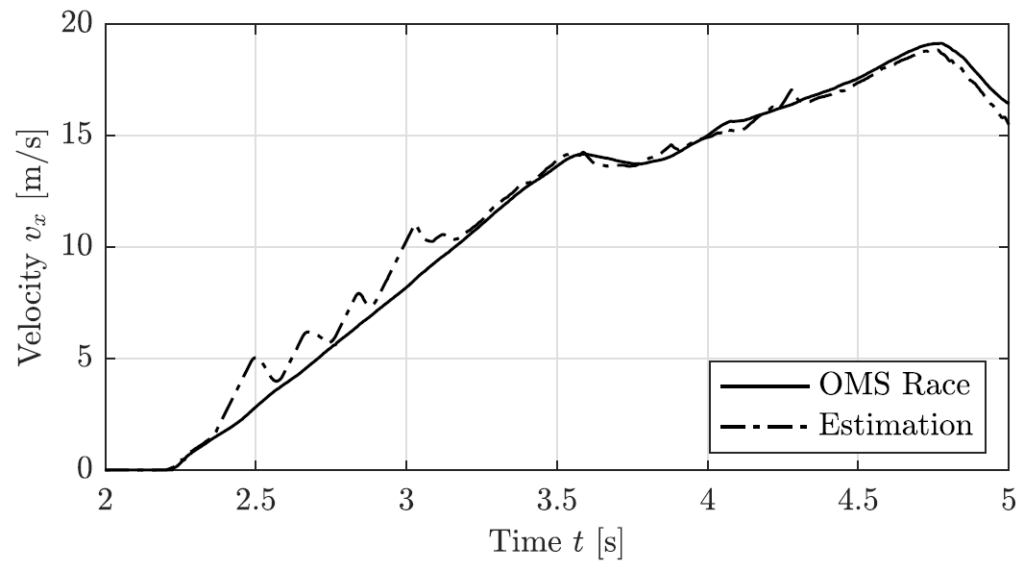
Vehicle velocity measured by the OMS Race compared to our
previous velocity estimation during the acceleration event.
The OMS Race, measuring velocity independently of tire dynamics, captured a smooth, physically consistent speed profile that matched the IMU data. With this ground truth in hand, the team was able to pinpoint and correct the weaknesses in their Kalman filter. The practical impact: significantly more consistent traction control behavior under grip-limited conditions. Less uncontrolled wheel spin means better longitudinal acceleration – a direct competitive advantage.
Pitch and Roll: Capturing What Damper Sensors Miss
The OMS Race also delivered accurate pitch and roll angle measurements. This matters because tire deflection accounts for a significant portion of actual vehicle pitch and roll – something damper travel sensors alone simply cannot capture. With the OMS Race data, the team could refine their vehicle dynamics models to better represent what the car actually does on track, rather than relying on incomplete suspension-based assumptions.
Vehicle Body Slip Angle: Unlocking a New Control Input
Perhaps the most significant breakthrough: for the first time, the team had access to reliable vehicle body slip angle data. Estimating lateral velocity from onboard sensors alone is notoriously difficult, and until now, that limitation had prevented the team from incorporating this information into their control system. The OMS Race changed that – opening the door to body-slip-based control strategies that can further improve both stability and cornering performance in future seasons.
The Bottom Line: Measurement Drives Results
The OMS Race proved to be both a high-impact performance tool and a powerful development asset for the Formula Student Team Delft. Slip-independent velocity measurements enabled more accurate state estimation, more consistent traction control, and ultimately better utilization of available tire grip. The result on track: a podium finish at Formula Student Germany.
The team plans to continue leveraging the OMS Race data in upcoming seasons – particularly by integrating vehicle body slip angle information more deeply into their control algorithms. The sensor’s full potential, in their own words, has yet to be fully exploited.
“Based on our experience, we would strongly recommend the OMS Race for applications requiring accurate, slip-independent vehicle state estimation – particularly in high-performance motorsport and autonomous vehicle development, where robust sensing is critical for both control and model-based design.”
– Formula Student Team Delft
Read the Full Application Report
Formula Student Team Delft documented their experience with the OMS Race in a detailed application report – covering sensor integration, test methodology, measurement results, and comparative data.